Economic characteristics of migrants in the UK in 2014
21 July, 2015
Contents
Summary
Key labour market outcomes of migrants to the UK show wide variation, particularly in employment status, wages and benefit claims. In these terms migrants from some regions have particularly strong economic characteristics compared to those born in the UK while others have much weaker economic characteristics.
Assessments of the current and future impact of immigration to the UK often assume that there is no difference in the economic characteristics of migrants in the UK. The justification given for this is that overall the migrant population tends to be younger and thus more likely to be working. However, such assessments rarely take into account either the type of employment or the rewards of it.
While much debate is conducted in terms that distinguish between EU and non-EU migration, it is clear that the picture of labour market outcomes is not simple, with both groups containing a mix of countries from which migrants to the UK exhibit very different characteristics.
The group of migrants in the UK from Western Europe, India, South Africa and the ‘Anglosphere’ exhibit strong economic characteristics – they have high rates of employment at good wages and low rates of benefit claim.
Migrants from Eastern Europe also have high rates of employment but they have lower wages and higher rates of benefit claim than those born in the UK.
Migrants from Africa apart from South Africa have overall employment rates and wages on a par with the UK-born, but much higher rates of benefit claim.
Migrants from Pakistan and Bangladesh have lower rates of employment combined with lower wages and higher rates of benefit claim.
Overall outcomes in comparison to the population of UK-born residents are summarised in the following table.
| Employment rate | Wages | Rate of benefit claim | Approx adult population | |
|---|---|---|---|---|
| EU15 | Better | Better | Better | 1.25 million |
| EU A10 | Better | Worse | Worse | 1.25 million |
| USA, Australia and NZ | Better | Better | Better | 250 thousand |
| Africa (excluding South Africa) | Similar | Similar | Worse | 1 million |
| South Africa | Better | Better | Better | 150 thousand |
| India | Better | Better | Better | 700 thousand |
| Pakistan and Bangladesh | Worse | Worse | Worse | 650 thousand |
| Rest of World | Similar | Slightly worse | Slightly worse | 2 million |
Some large migrant populations are not strong economic performers when examining these three key characteristics, and economic performance even equivalent to that of the UK-born population cannot be inferred simply from generally younger age or likelihood of being in work.
Introduction
1. This report describes labour market outcomes and key economic characteristics of migrants in the UK in early 2014. The data is largely derived from the UK Labour Force Survey. As noted by the Home Office in its extensive review “Impacts of migration on UK native employment: An analytical review of the evidence” their assessment is that the LFS is currently the most complete data source for examining the impacts of migration on the UK labour market. This paper noted that much previous research was based on periods prior to the economic recession starting in 2008. While the most recently published academic paper in this area[1] is based on data up to and including the 2011/12 fiscal year, its reporting of most recent key economic characteristics (and hence calculated outcomes) are based on averages over a period stretching back to 2001, and these are not necessarily any guide to what is happening now. The Migration Observatory at Oxford University publishes a helpful and regularly updated series of briefings about migrants in the UK [2], and this report complements these with a more detailed analysis of some key aspects.
2. The second quarter of 2014 is used and the report generally follows the split into world regions used by the Office for National Statistics in its quarterly reporting of migrants in the UK labour market.
3. For the purpose of this report, unless stated otherwise, ‘migrant’ means someone born outside the UK. This is conventional in examining these aspects of migration. Studies that treat as migrants only those people who currently have non-UK nationality cannot give a proper comparative account of the outcomes of migration from different countries as there are significant differences in both ability and preference to acquire UK nationality.
People
4. Figure 1 shows that adult migrants in the UK are predominantly in age bands between 25-44. These data show migrants accounting for a quarter of the UK population who are in their thirties, but less than half that proportion among those who are in their fifties.
Figure 1

5. Figure 2 shows the number of adults (16+) in the UK by country of birth groups. Africa, the Indian sub-continent, Western Europe and Eastern Europe each account for over a million, and Rest of World for a further two million.
Figure 2

People working
Employment levels
6. Migrants have formed a very significant part of growth in the numbers of people working in the UK economy. Figure 3 shows the scale of the increase in employment in the UK for people born outside the UK since 1997. Numbers have doubled since the beginning of that year even if no account at all is taken of EU expansion, and the upward trend has been little affected by recession. The picture is of an overall continuous and continuing increase.
Figure 3

Employment rates
7. The employment rate for people born abroad has historically been rather lower than among the UK-born (Figure 4). This is presumed to have been due to a combination of barriers to employment and differing attitudes to roles within families. However, in recent years the gap has fallen sharply, driven by rapid increases in employment participation by particular national groups, reducing from 10 percentage points to only 3 percentage points. It is the increasing employment rate of people born outside the UK that has driven the UK’s employment rate to recent highs, the employment rate for the UK-born still over five years after the recession below levels consistently maintained prior to 2008.
Figure 4

8. Compared to 1997, the employment rate for the UK-born was little changed by 2014. Rates of growth for country groups showed significant variation. Figure 5 shows that Pakistan and Bangladesh had the greatest growth, albeit from the lowest base, as employment levels for this group more than doubled. The initial wave of ‘accession’ countries from Eastern Europe increased by a large amount too, while employment levels for this group increased from the lowest to the second highest.
Figure 5

Employment type
9. Overall employment rates do not tell the whole story, and there are large differences in employment type between the migrant population and those born in the UK, and gender differences too. Figure 6 shows that for men, headline employment rates for the adult (16+) population are higher for all migrant groups. In particular, among large migrant groups, the full-time employment rates for people born in the Eastern European A10 group and Western European EU14 group are significantly higher than for the UK-born population, as is to be expected if a high proportion are of prime working age. However, full-time employment rates for Africa (excluding South Africa), Pakistan and Bangladesh, and Rest of World are either essentially no higher or actually lower than for the UK-born population despite the more favourable demographic.
Figure 6

10. Employment rates for women are all lower than for their male counterparts, and are further generally characterised by a higher proportion of part-time working, as shown in Figure 7. For example, UK-born men are only around 20% more likely to be in work than women, yet around 50% more likely to be in full-time employment. There are also greater differences in female employment among migrant groups than there are in male employment, with 80% of women from Australia and New Zealand working, and only 20% of women from Pakistan and Bangladesh.
Figure 7

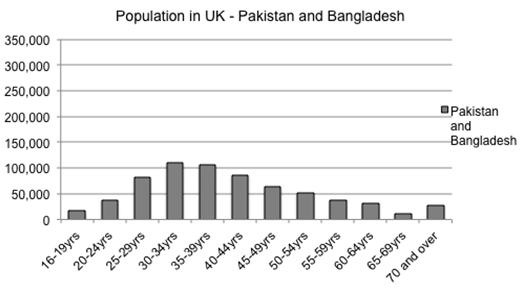
People not working
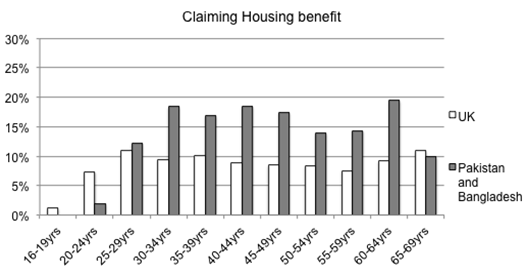
11. People who are not working can be divided into two groups. The first group is of people who are active in the labour market and comprises those unemployed people looking for work whether they are claiming unemployment benefits or not. The second group is of people who are inactive in the labour market and comprises people who are neither working nor looking for work. This includes most people in full-time education and people who have retired from work as well as those who are unable to work or who choose not to work, often because they are looking after children.
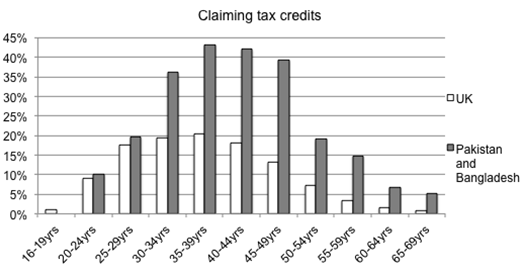
Inactive
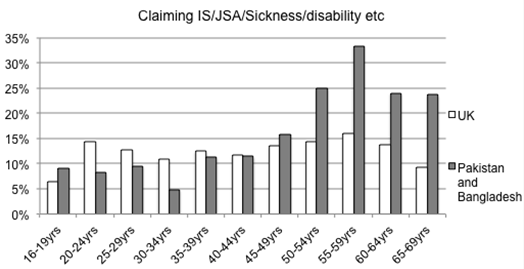
12. Figures 9 to 12 show the different reasons that men and women who are neither students nor retired from work give as their main reason for not looking for work. Among UK-born men in this group, by far the largest proportion give long-term sickness or disability as the main reason they are not looking for work.
Figure 9

A smaller proportion of men born outside the UK give this as their main reason, particularly when younger, with a significant proportion in some age-bands giving unspecified ‘other’ reasons.
Figure 10

13. Compared with men, a very much higher proportion of women in this group are not looking for work because they are looking after the family home.
Figure 11

This is particularly so for those born abroad who are further generally characterised by considerably lower levels of long-term sickness or disability as the main reason they are not looking for work.
Figure 12

Unemployed
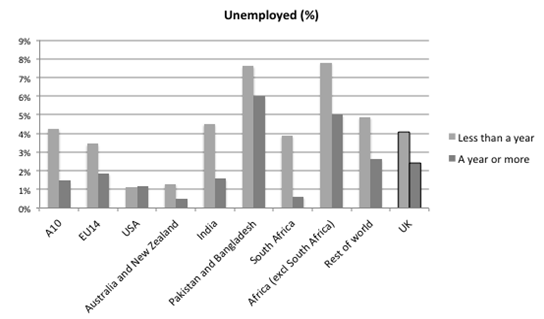
14. Unemployment is measured as the percentage of those who are active in the labour market who are looking for work, i.e. excluding those who are not looking for work. Figure 8 shows the relative proportions of those aged 16-64 who have been unemployed for less than a year and those who have been unemployed for a year or more. The overall unemployment rate for each group is the sum of these two – for example for people born in the UK, 4% of the economically active population were unemployed and had been for less than year while 2.4% were unemployed and had been for a year or more, giving an overall unemployment rate of 6.4%.
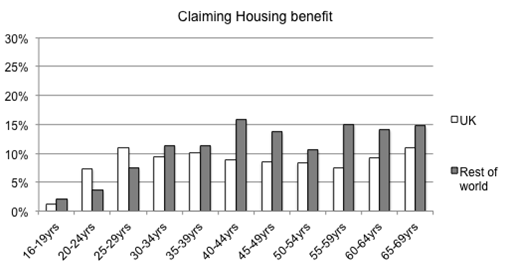
15. Shorter-term unemployment for the larger country groups are little different from the UK-born rate, with the exception of Africa (excluding South Africa) and Pakistan and Bangladesh, which are nearly twice as high. Longer-term unemployment rates are rather lower than the UK-born rate, again with the exception of Africa (excluding South Africa) and Pakistan and Bangladesh, which are more than twice as high.
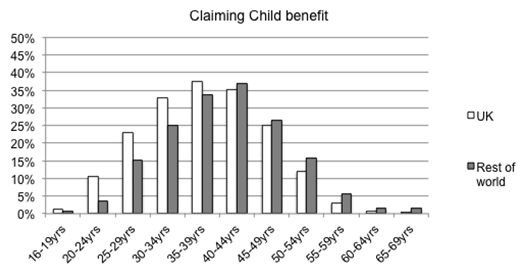
Figure 13
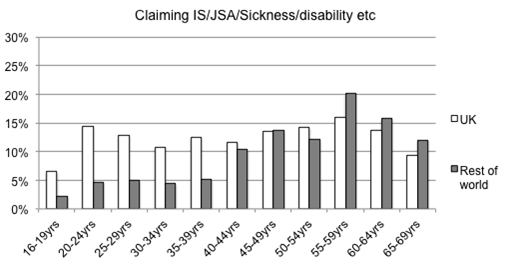
Wages
16. Earnings of migrants in the UK are often reported and compared on the basis of hourly earnings. This will tend to obscure differences in income arising from the different proportions working full-time and part-time within different migrant groups (as in Figures 6 and 7 above) and any differences in hours worked within the full-time and part-time groups. In terms of the ability of people to provide for themselves, what matters is the income derived from working, not the hourly rate of pay. For this reason, we report gross weekly pay to compare earnings of migrant groups.
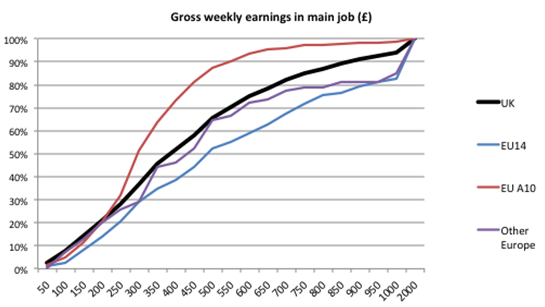
17. The Labour Force Survey is an incomplete record of earnings because it only includes earnings from work as an employee, not earnings from self-employment. This will make more of a difference to some groups than others, as noted below. Further, only a proportion of respondents are asked questions about their earnings, and so results in this area do not have the same level of statistical reliability as results for employment status, benefit receipt etc. However, as this survey is one of the few sources of information on earnings that is directly associated with country of birth, it is conventionally used in academic research. This section shows the cumulative distribution of these gross weekly earnings by country groupings, thus the 50% line represents median earnings.
Europe
18. Figure 14 shows that migrants from Eastern Europe (A10) have an income distribution very much biased towards the lower end of the income distribution of the UK-born population. Some 70% of people from these countries have earnings less than the median earnings of the UK-born, and nearly 90% less than an annualised £26,000. Conversely, over 60% of those from Western European countries earn more than the UK-born median, with a markedly higher proportion at the very highest income levels. The distribution of those from other European countries closely follows that for the UK-born but again with a markedly higher proportion at the very highest income levels. The five largest members of this ‘Other Europe’ group are Turkey, Russia, Switzerland, Cyprus and Norway.
Figure 14
USA, Australia and New Zealand, South Africa
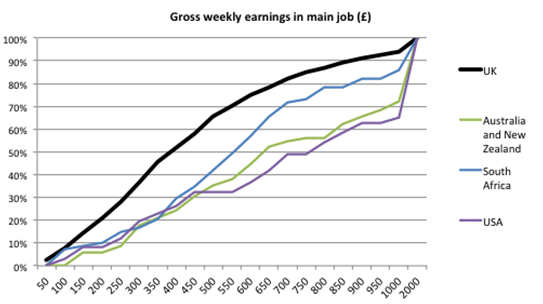
19. These countries show much higher earnings than for the UK-born population, less than 25% being below the UK-born median, and with very high levels of the highest incomes among people born in the USA and in Australia and New Zealand.
Figure 15
Asia and the Middle East
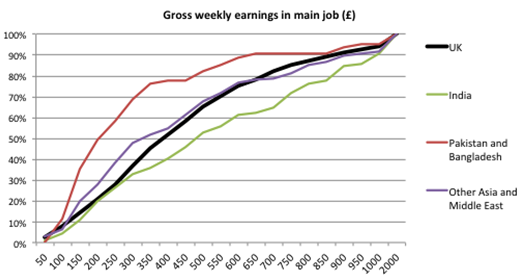
20. Earnings for people born in India match those for the UK-born very closely in the lower third of the income distribution but are then consistently higher. People born in Pakistan and Bangladesh tend to have very much lower earnings than the UK-born, with nearly 80% below the UK-born median, although there are a small number of very high earners. The pattern for the rest of Asia and the Middle East is of overall similarity to the UK-born, but with the distribution biased towards both ends, reflecting the mix of different countries within this group, though more to the bottom than the top.
Figure 16
Africa and the Americas
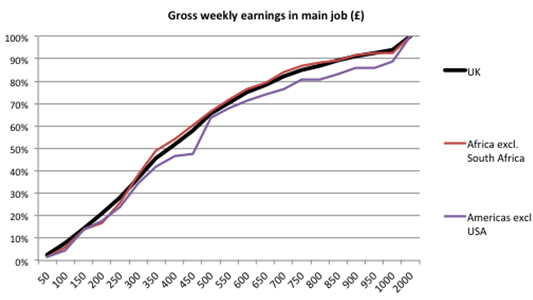
21. These groups comprise Africa excluding South Africa, and the Americas and Caribbean excluding USA. Of all the country groupings, the income distribution for African employees follows most closely the distribution for those born in the UK. For the lower third of the income distribution, so do earnings for people born in the Americas and Caribbean, although they are then slightly higher over the rest of the income distribution and with a clear uptick at the highest earning levels.
Figure 17
Benefits
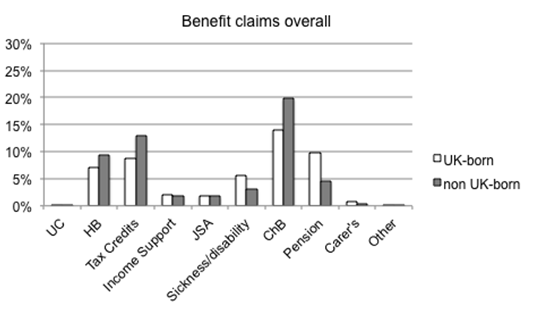
22. Benefit claims are divided into a number of discrete groups in the Labour Force Survey. These benefits account for a large part of 'welfare' spending on people of working age and children, comprising for example Housing benefit in 2013/14 costing £18 billion for people below pension age, tax credits costing £29 billion, and Child benefit £11 billion. Looking at overall results it can be seen from figure 18 that rates of claim for Housing benefit, tax credits and Child benefit among the migrant population are considerably higher than among the UK-born. Rates of claim for Income Support and Jobseeker’s Allowance differ little between migrants and the UK-born: these cost around £7bn. Migrant rates of claim are noticeably lower only for sickness/disability benefits and the various allowances for carers etc.
Figure 18
23. The data about benefit claims in the Labour Force Survey apply only to respondents who are aged between 16 and 69 unless they are outside this age-band but in work. This means that the LFS is not a reliable means of any estimation of overall receipt of state pension or of any benefits for those 70 or over and leads to the apparent low prevalence of pension claim. For this reason the 70 or over age band is not included in the figures below other than in illustrations of total population.
24. In the following section these overall benefit claims are firstly repeated but broken down by age, then broken down by both ONS broad country grouping and age. Claims for benefits with distinctly higher prevalence overall – Housing benefit, tax credits and Child benefit – are separately identified. The other benefits with distinctly lower prevalence overall – Universal Credit, Income Support, Jobseeker’s Allowance, sickness/disability benefits, carers’ allowances and other minor benefits - are combined. The low rates of claim of some of these latter benefits by some country groups, and the possibility of claiming multiple benefits, mean some sample sizes are small and any apparently anomalous figures for these should be treated with caution. Pensions are not included because of their restricted coverage in these LFS variables as noted above.
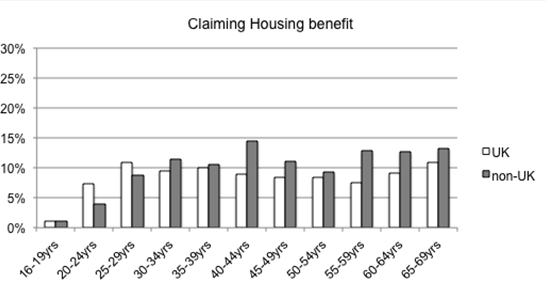
25. Housing benefit claims show a fairly flat profile with greater prevalence among migrants for all ages over 29 years old. For people in their forties, rates of claim are nearly 50% higher.
Figure 19
26. Tax credits claims show that at younger ages the UK-born are more likely to be claiming tax credits. This might derive from the fact that below the age of 25, tax credits are only available to those with children or a disability - and the analysis of reasons for not working at Figures 9 to 12 above tend to support this. At 25 and over, migrant rates of claim quickly catch up and then outstrip rates of claim by the UK-born at all ages from 35 upwards.
Figure 20
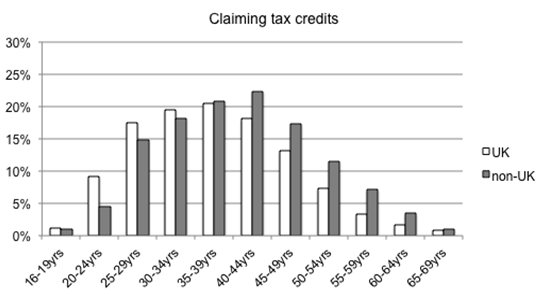
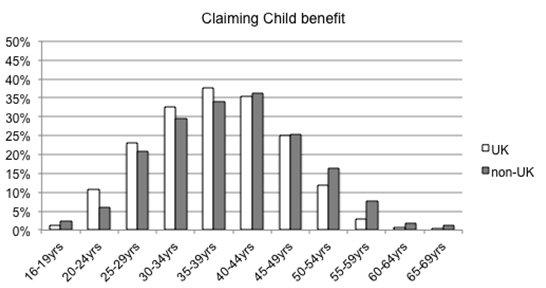
27. Child benefit claims follow a not dissimilar pattern overall, but comparing with tax credits, suggests that greater prevalence of tax credits claims among migrants shown above is likely to derive from lower incomes rather than a higher proportion with children.
Figure 21
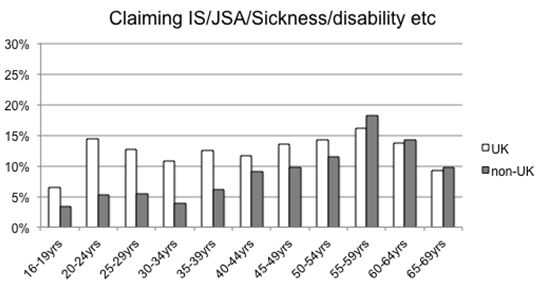
28. Other benefits are largely comprised of those often referred to as ‘DWP key out-of-work benefits’. Figure 22 shows a different pattern, with claims by people born abroad being overall well below the levels of those born in the UK in younger age-bands, but steadily increasing to around parity from 55 years of age onwards. This is in line with employment rates and for those not working the reasons given for not looking for work.
Figure 22
Benefit claim by country of birth groups and age band
29. This section illustrates first the numbers within each age band for a country grouping. This is important to give context to both high and low claim rates. It then proceeds as before comparing rates of claim to the UK-born population by country grouping.
EU A10: Bulgaria, Czech Republic, Estonia, Hungary, Latvia, Lithuania, Poland, Romania, Slovakia and Slovenia.
30. The numbers of people in the UK from Eastern Europe have increased very significantly since 2004 when eight of these countries joined the EU with no restrictions on working in the UK, followed by Romania and Bulgaria for whom restrictions remained in place until 2014. The adult age profile is very much younger than for any other country group, and the male full-time employment rate higher.
Figure 23
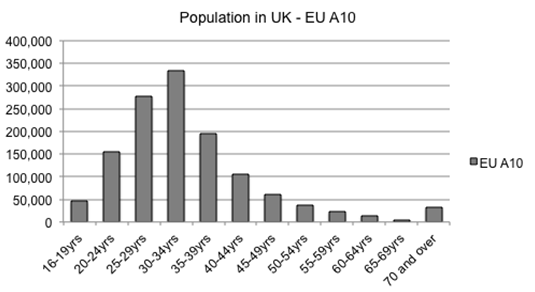
31. This does not translate into unequivocal economic success, with housing benefit claim rates being around or above UK-born levels for the largest age-groups by number, despite a higher employment rate.
Figure 24
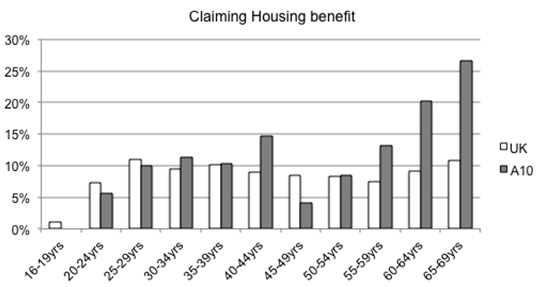
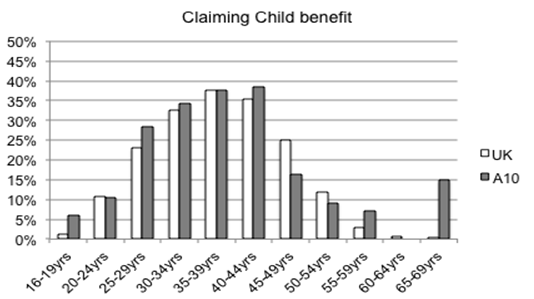
32. Rates of claiming tax credits are noticeably high despite little difference in rates of claiming child benefit, pointing to greater difficulty in supporting their families despite being in work, consistent with overall much lower earnings.
Figure 25
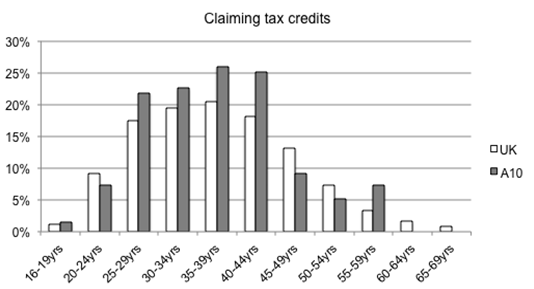
Figure 26
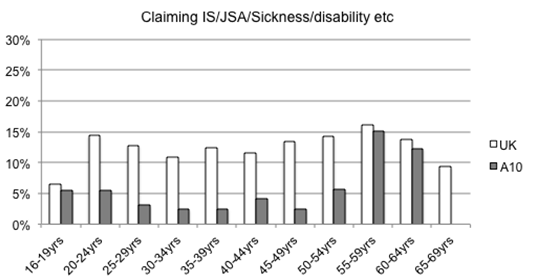
33. However, as might be expected bearing in mind high employment levels, rates of claiming DWP key out-of-work benefits are very low in comparison.
Figure 27
EU14: Austria, Belgium, Denmark, Finland, France, Germany, Greece, Ireland, Italy, Luxembourg, Netherlands, Portugal, Spain and Sweden.
34. The adult population in the UK from Western Europe is not very different from Eastern Europe in total number, but the age distribution is quite different, with a large number being over retirement age.
Figure 28
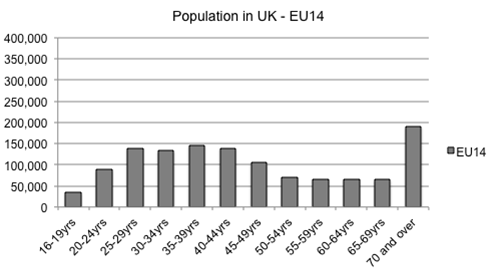
35. While younger Western Europeans are much less likely to be claiming housing benefit, older people are rather more likely to be claiming than their UK-born equivalents.
Figure 29
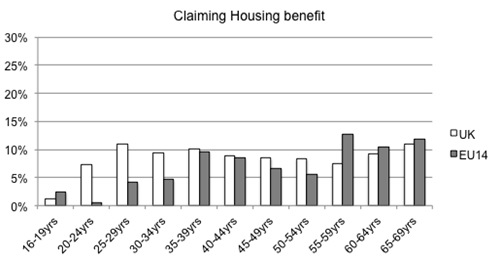
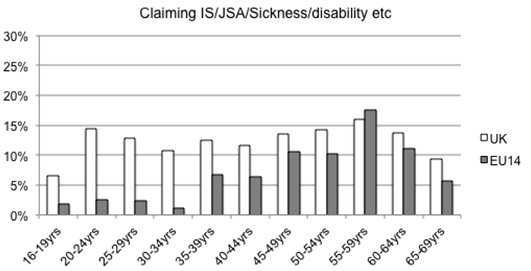
36. A similar pattern is observable for tax credits, child benefit and DWP benefits, with lower rates of claim for younger age groups, and higher rates for older age groups.
Figure 30
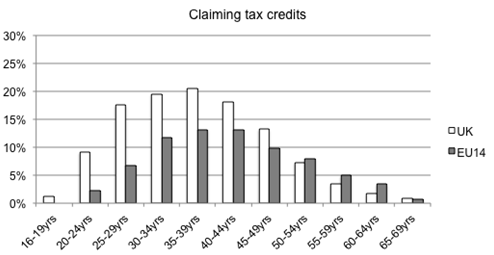
Figure 31
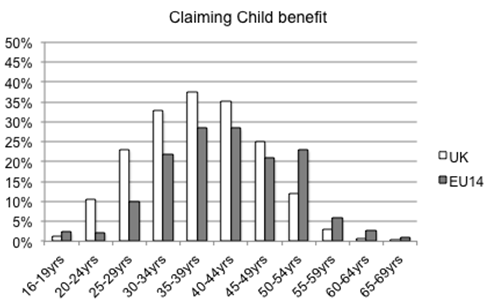
Figure 32
United States of America
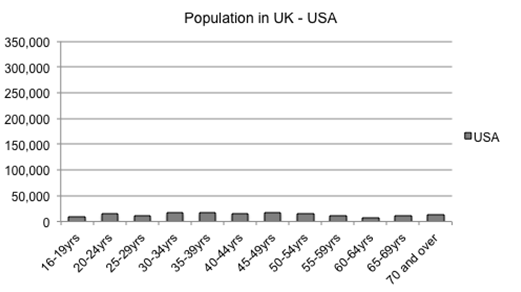
37. The number of people in the UK born in the USA is not much over 100,000 with employment levels being somewhat higher than for the UK-born.
Figure 33
38. Levels of benefit claim are very low, the only notable divergence - in tax credits claims for 45-49 year olds - is likely to derive from small sample size in the Labour Force Survey.
Figure 34
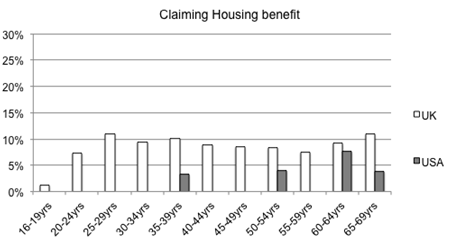
Figure 35
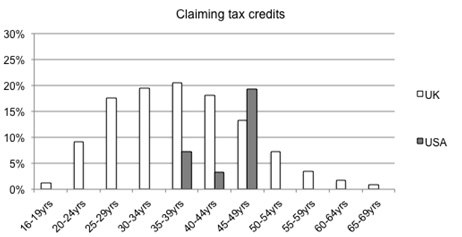
Figure 36
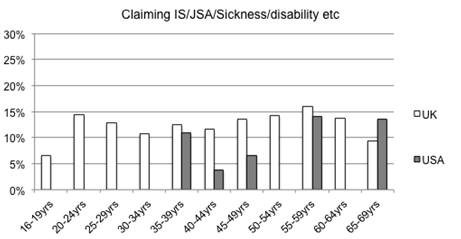
Figure 37
Australia and New Zealand
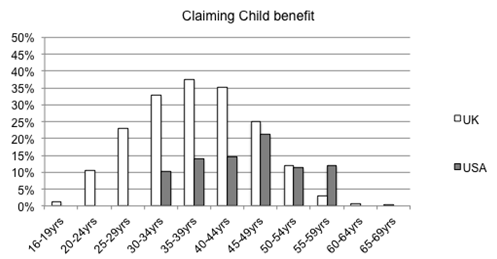
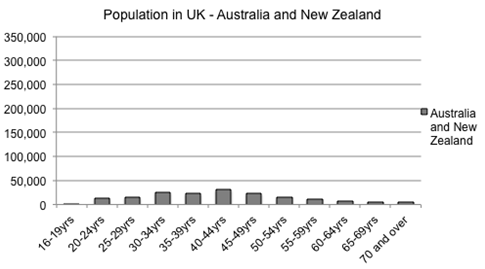
39. Similar in size to the USA-born population, people born in Australia and New Zealand tend to be younger, and share high levels of employment, with female full-time employment in particular being nearly twice the rate for the UK-born.
Figure 38
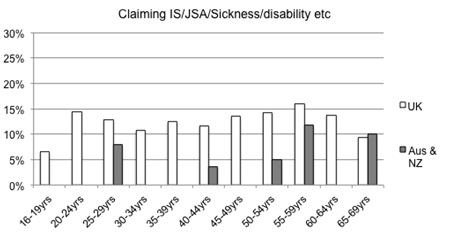
40. Income levels are high too, and rates of means-tested benefit claim are again very low,
Figure 39
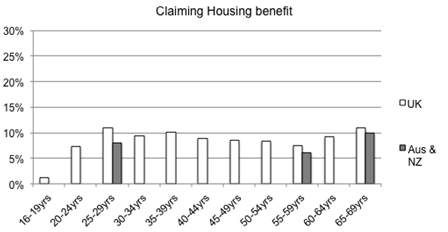
Figure 40
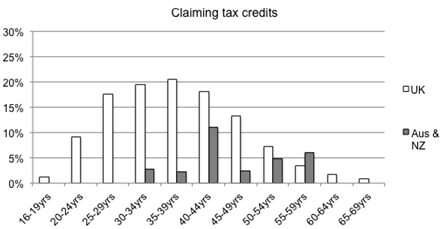
Figure 41
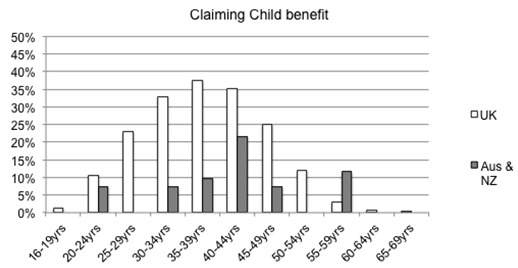
41. And child benefit claims indicate a low proportion of people with children throughout.
Figure 42
India
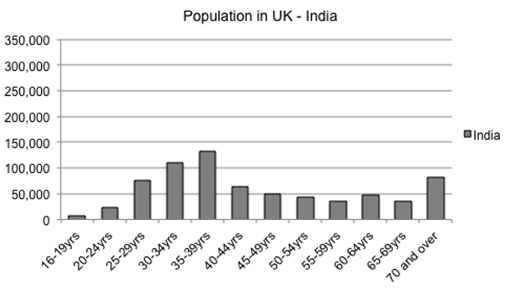
42. The Indian-born population in the UK is a little over half the size of the population born in Western Europe and has a similar age distribution. Employment rates are similar too, though slightly higher for men and slightly lower for women.
Figure 43
43. Rates of housing benefit claim are very low for younger working-age people born in India, but much closer to UK-born rates for those aged 55 and over.
Figure 44
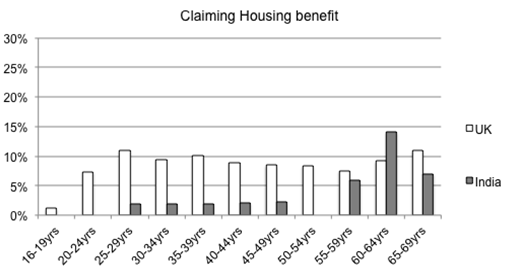
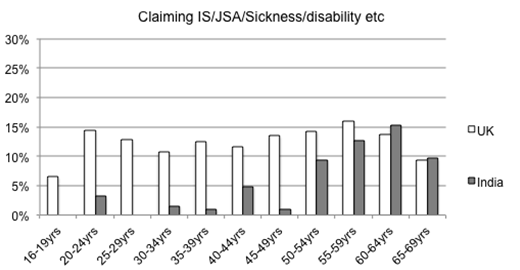
44. The pattern for in-work and DWP benefits is very similar to that for Western Europeans, with significantly lower rates than the UK-born at younger ages, but increasing at older ages and associated with generally older age of people with children.
Figure 45
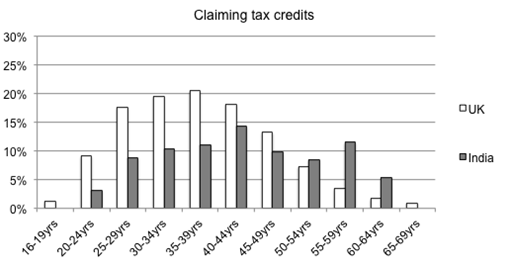
Figure 46
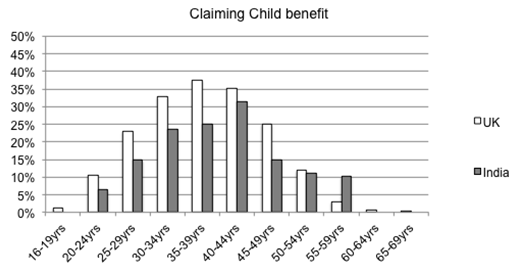
45. It is notable that for such a large population, the numbers claiming child benefit are considerably lower than for the UK-born. It is the only large population with this characteristic.
Figure 47
Pakistan and Bangladesh
46. The UK population born in Pakistan and Bangladesh is a similar size to the Indian-born group, but is notable for a smaller proportion post working-age than any large group other than Eastern Europeans. While overall employment levels for men appear quite high, even exceeding those for the UK-born and Western Europeans, a greater proportion are working only part-time or are self-employed than any other group. Barely a third of men are in work as full-time employees. Employment rates for women are less than half those for any other group, and of these only half work full-time, meaning only 10% are in full-time work.
Figure 48
47. Rates of housing benefit claim are considerably greater than the UK-born rate for those aged 30 and over.
Figure 49
48. Rates of tax credit claim approach and exceed twice the UK-born rate, with particularly large differences as age increases.
Figure 50
49. Claims for key DWP benefits can be observed throughout the age distribution, and become much higher than for the UK-born at older ages.
Figure 51
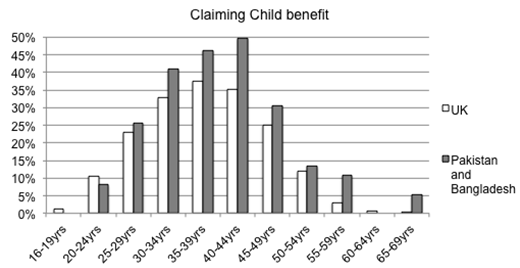
50. At all ages from 25 years upwards, child benefit claims are higher than for the UK-born.
Figure 52
South Africa
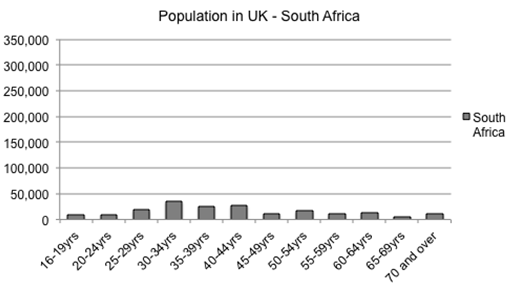
51. The South African-born population in the UK is a little larger and a little younger than the USA and Australia/New Zealand groups. It has slightly lower 16+ employment rates, though higher than for the UK-born.
Figure 53
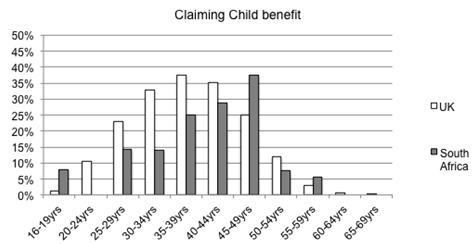
52. High earnings are associated with low rates of claim to benefits
Figure 54
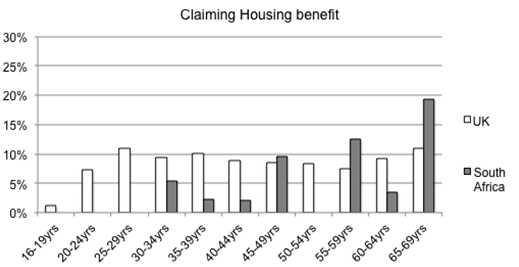
Figure 55
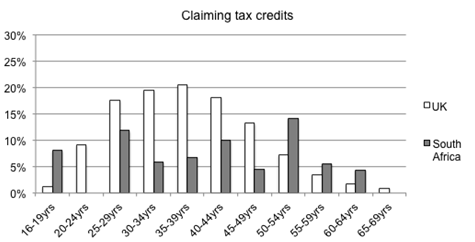
Figure 56
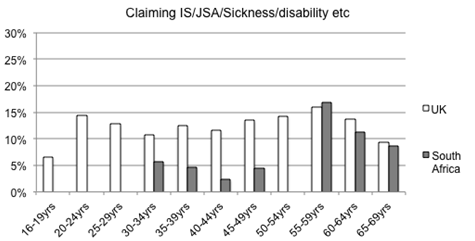
Figure 57
Africa excluding South Africa
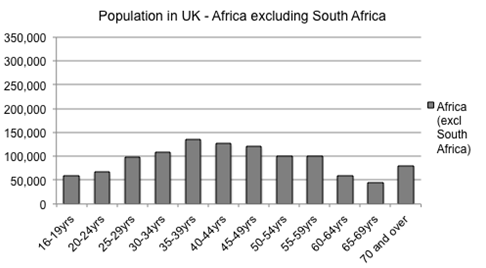
53. Over a million adults born in Africa (excluding South Africa) are living in the UK, with a more middle-aged age distribution than the other large country groups, but fewer post working-age. This means that while employment rates are higher than for the UK-born overall, they are lower when comparing those only aged 16-64.
Figure 58
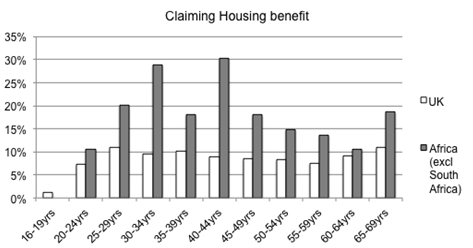
54. This group has the highest rates of claim for housing benefit by some margin, likely to arise from a high proportion living in London despite poor gains from employment, with the result that nearly a quarter in the prime 25-49 year age-bands are claiming housing benefit.
Figure 59
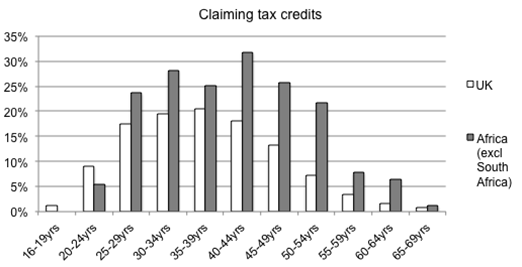
55. Tax credits claim rates are higher too, with the difference compared to the UK-born increasing with age, closely following the pattern of child benefit claims, indicating a higher proportion of older adults with dependent children, and an even higher proportion of these needing welfare support.
Figure 60
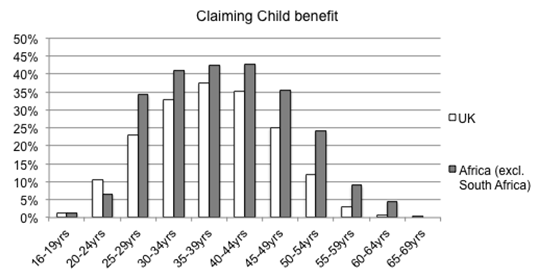
56. Rates of child benefit claim are higher throughout
Figure 61
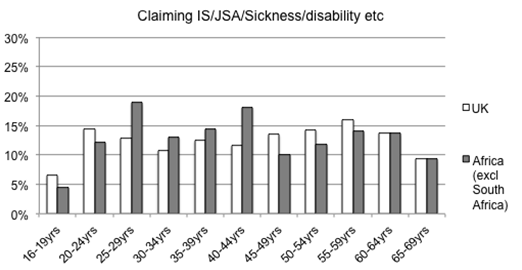
57. In contrast to all other country groups, rates of claim for key DWP benefits are high throughout the age distribution and exceed those for the UK-born in the 25-44 age bands.
Figure 62
Rest of the world
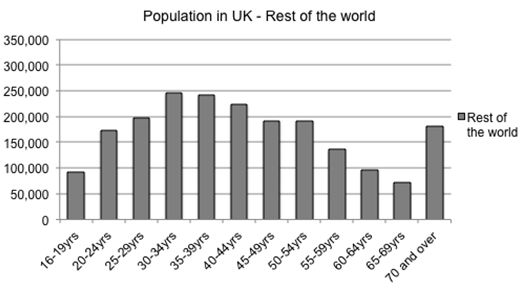
58. This is the largest single grouping of countries, with two million people born abroad. The five largest countries within this group by adult population in the UK are Sri Lanka, Philippines, China, Jamaica and Turkey.
Figure 63
59. This large group has higher rates of housing benefit claim than the UK-born population, particularly from the age of 40 onwards.
Figure 64
60. A similar association of rate of claim with age is observable for tax credits, with those under 35 being very much less likely to be claiming, and those above 40 more likely to be claiming. This follows the pattern for child benefit claim rate, suggesting that a key reason is that younger people in these groups are overall less likely to have children. But once they do have children, their rates of claim are similar to or slightly greater than for the UK-born population.
Figure 65
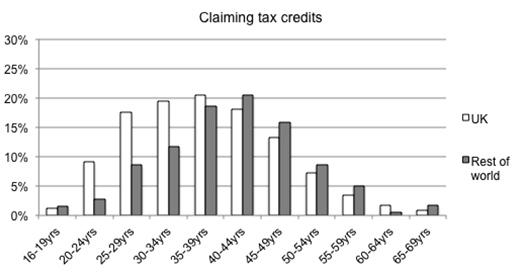
Figure 66
61. At younger ages, claim rates for key DWP benefits are less than half those of the UK-born population, but from 40 upwards average out as slightly higher than for the UK-born.
Figure 67
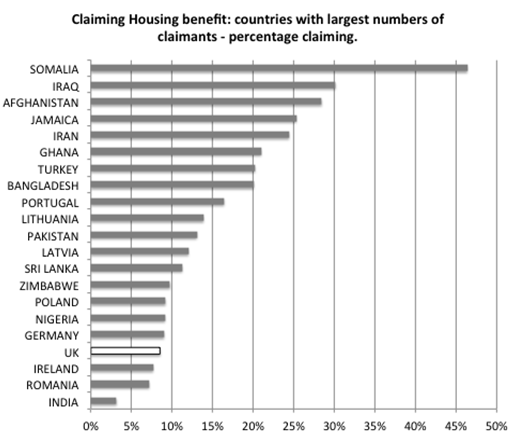
62. To provide further insight, figure 68 shows the 20 countries of birth with the largest numbers of claims to housing benefit, and ranks these by the percentage of the population born in those countries claiming. These show that for some countries with large populations in the UK, rates of claim among these populations can be a number of times greater than for the UK population.
Figure 68
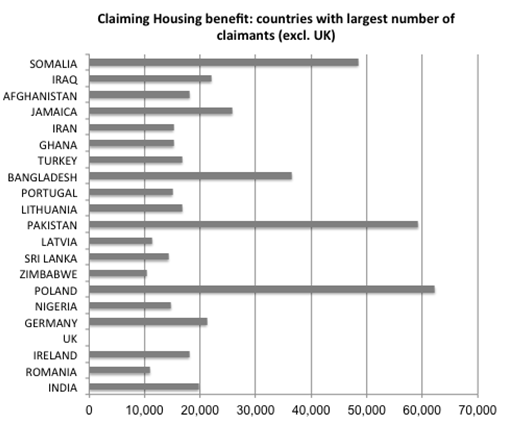
63. Figure 69 has these countries arranged in the same order but showing the number of claimants involved.
Figure 69
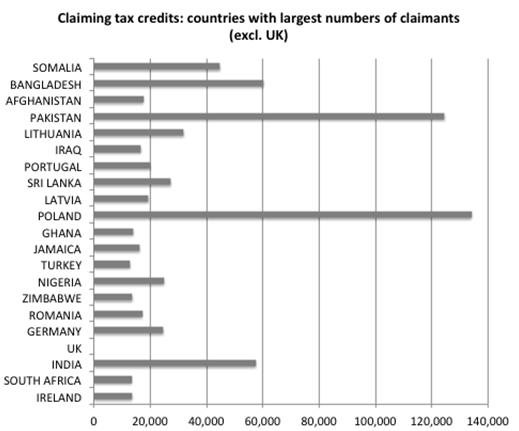
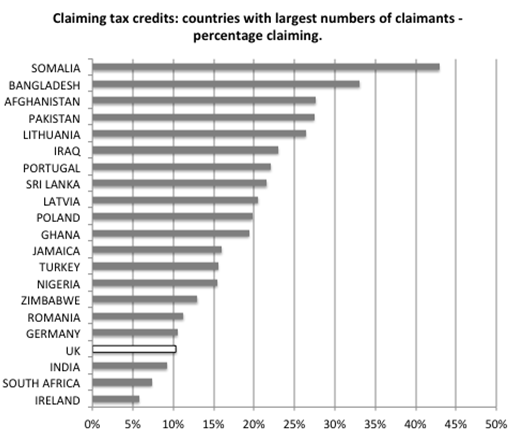
64. Figure 70 shows the 20 countries of birth with the largest numbers of claims to tax credits, and again ranks these by the percentage of the population born in those countries claiming. This shows too that for some countries with large populations in the UK, rates of claim among these populations can be a number of times greater than for the UK population.
Figure 70
65. Finally, Figure 71 has these countries arranged in the same order but showing the number of claimants involved.
