The impact of immigration on housing demand
13 June, 2006
Summary
1. Since coming to power in 1997 the government has encouraged much higher levels of immigration. Net international migration has increased from an average of about 50,000 per year in the period 1993-7 to 166,000 in 1998-2004. However, the government failed to adjust the housing programme to take account of this extra demand. These high levels of international migration have been a major factor in the housing shortage and have contributed to the rise in house prices which, in turn, has led to serious problems of affordability. The impact will be particularly strong in London and the South-East which receives 75% of the net international migration flow as well as in the South-West, East and East Midlands regions which are the main recipients of secondary (internal) migration from London and the South-East.2. If, instead of net immigration levels increasing, we had reverted to the pre-1980 position where there were as many (or more) people emigrating from England as immigrated here, the rise in the housing stock from 1996-2004 would have outpaced the rise in households by about 200,000 houses. This would have had a beneficial impact on the affordability of housing.
Introduction3. Every few years the Department for Communities and Local Government (formerly the Office of the Deputy Prime Minister) produces projections of households in England[1]. They are based on population projections produced by the Government Actuary’s Department (GAD) and they take account of changing trends such as immigration and the growing number of single households.
4. These household projections are a major input to the planning process including, importantly, house building plans.
Household projections
5. A detailed set of household projections[2] was produced in 2000 based on the 1996 population projections. The latter assumed net international migration of 65,000 a year.
6. These household projections showed the total number of households rising from 20,186,000 to 20,992,000 between 1996 and 2001, an average of 161,200 p.a., and from 20,992,000 to 21,733,000 between 2001 and 2006 an average of 148,200 p.a.
7. However, the GAD assumption of net international migration of 65,000 a year proved to be a gross underestimate because of the much higher levels of immigration stimulated by the government. This coincided with a large increase in asylum claims. As a result, net international migration in the period from 1996 to 2004 inclusive has averaged 140,000 a year rather than the 65,000 that the government assumed.[3]
The Housing Shortfall
8. International migration at a rate above the GAD assumption of 65,000 was expected to create an additional household for every 3 additional immigrants.[4]
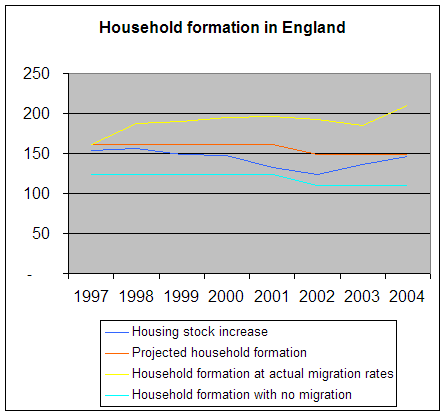
9. The following graph plots:
the household formation rates based on the 1996-based assumptions;
the household formation rate adjusted for actual rates of migration;
and the household formation rates based on zero net migration
against the increase in housing stock in England over these years[5].

10. The graph shows clearly how the increase in housing stock (the dark blue line) lags behind the household formation rate based on the original assumption about immigration (the orange line) and that it is consistently well short of the household formation rate based on actual levels of international migration (the yellow line).
11. The graph also shows that, without international migration, the increase in housing stock would have comfortably outpaced the projected increase in households (the light blue line).
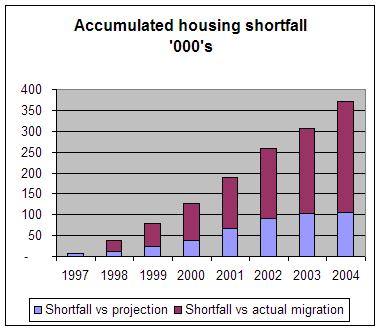
12. Over these eight years the housing stock has increased by about 370,000 less than the rate of household formation based on the actual rate of international migration. 260,000 (70%) of this shortfall results from the increase in international migration above its anticipated levels, as illustrated in the following bar chart.

13. It is clear that the rapid increase in net international migration since 1997 has not been catered for by a commensurate increase in the house building programme. This has been a major factor in the demand for housing outstripping supply and will have had a significant impact on affordability.
14. In contrast if, instead of an increase in net international migration, we had returned to the situation which pertained prior to the early 1980’s, where net international migration into England was zero (i.e. as many emigrants as immigrants), or less, the rise in the housing stock would have outstripped the increase in households by nearly 200,000 houses in the period 1996-2004.
15. International migration will also have a major impact on future housing requirements. Updated household projections have been produced in 2004 and in 2006. These are now based on net international migration rates of 130,000 a year. Migration Watch briefing papers 7.5 and 7.6 showed that immigration will, on the government’s own projections, account for 1 in 3 new households, requiring 1.5 million new homes in the period 2003 – 2026.
Footnotes
| [1] | A household is defined as: one person living alone or; a group of people living at the same address who share common housekeeping or a living room. |
| [2] | Office of the Deputy Prime Minister: Housing Statistics – Projections of Households in England 2021 |
| [3] | ONS: International Migration – Series MN31 |
| [4] | Based on Parliamentary Answer given to Lord Rooker on 8 Dec 2004 which said that about 59,000 additional households per year are attributable to net international migration [based on net migration of 130,000 p.a.] compared with 38,000 p.a. [based on net migration of 65,000 p.a.] |
| [5] | ODPM: Dwelling Stock by tenure England (historical series) – total dwellings |
